

Mastering Excel skills is a must for business students, unlocking the power of business analytics to excel in academics and kickstart a career. Whether you’re tackling finance assignments or preparing for internships, a strong command of Excel sets you apart in your first year of business studies. This article offers a step-by-step guide and practical tips to learn Excel skills, apply them in projects, and boost your professional edge. With clear examples, actionable insights, and career-focused advice, this guide will help you shine in your studies and beyond.
Why Excel Skills Matter for Business Studies
Excel skills are essential for business students, providing tools to analyze data, solve problems, and make informed decisions. Microsoft Excel, a leading spreadsheet software, is widely used in industries like finance, marketing, and operations, making it a core skill for BBA students. From creating budgets to visualizing trends, Excel supports coursework in business analytics, economics, and management.
Excel’s versatility is highlighted in resources like Microsoft’s Excel Help Center, which notes its role in data-driven decision-making. For students, mastering Excel skills early builds confidence and employability.
Importance of Excel
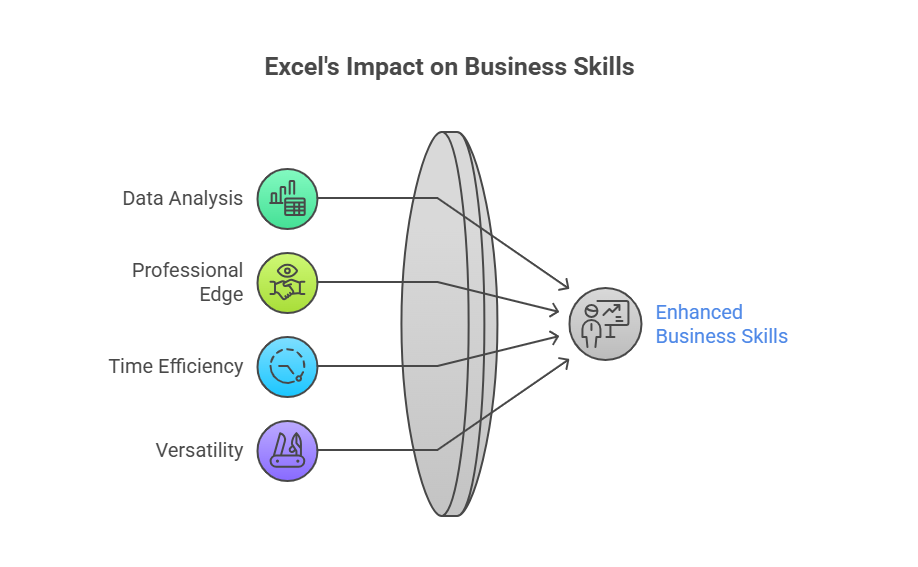
- Data Analysis: Simplifies calculations for projects or exams.
- Professional Edge: Impresses recruiters during internships.
- Time Efficiency: Automates repetitive tasks like budgeting.
- Versatility: Applies to finance, marketing, and economics.
Action Tip: Start practicing Excel in your first semester for academic projects.
Key Excel Skills and How to Master Them
Here are essential Excel skills for BBA students, with guidance on learning them:
- Basic Formulas and Functions
- Use formulas like SUM, AVERAGE, IF, and VLOOKUP for calculations.
- Example: A student calculates total sales using =SUM(B2:B10) for a marketing project.
- How to Learn: Practice with sample datasets (e.g., sales or expenses) from Excel Easy.
- Details: Formulas are the foundation of business analytics.
- PivotTables for Data Summarization
- Create PivotTables to analyze and summarize large datasets.
- Example: A student groups sales data by region to identify trends.
- How to Learn: Use Excel’s “Insert PivotTable” feature with a dataset like student grades.
- Details: Ideal for economics or market research assignments.
- Charts and Data Visualization
- Build bar, line, or pie charts to present data visually.
- Example: A student creates a pie chart to show expense categories for a college event budget.
- How to Learn: Explore Excel’s “Insert Chart” options with sample data.
- Details: Enhances presentations for viva or projects.
- Conditional Formatting
- Highlight data based on conditions (e.g., low sales in red).
- Example: A student marks failing grades below 40 in a class dataset.
- How to Learn: Use Excel’s “Conditional Formatting” tool on practice sheets.
- Details: Makes data analysis faster and clearer.
- Data Cleaning and Sorting
- Remove duplicates, sort data, or filter rows for accuracy.
- Example: A student filters customer data to focus on high-value clients.
- How to Learn: Practice with Excel’s “Data” tab on messy datasets.
- Details: Critical for reliable business analytics.
Table: Essential Excel Skills
| Skill | Key Benefit | Challenge | Action Tip |
|---|---|---|---|
| Formulas and Functions | Simplifies calculations | Syntax errors | Practice SUM, IF, VLOOKUP |
| PivotTables | Summarizes large data | Complex setup | Use sample datasets |
| Charts | Enhances presentations | Choosing right chart type | Experiment with bar/pie charts |
| Conditional Formatting | Highlights key insights | Overuse confusion | Apply to grades or sales |
| Data Cleaning | Ensures accuracy | Time-consuming | Practice sorting/filtering |
Action Tip: Dedicate 30 minutes weekly to practice one skill.
Tips for Applying Excel in Academic and Professional Tasks
Maximize your Excel skills with these tips for BBA students:
- Use Excel for Academic Projects
- Apply formulas or charts to economics or finance assignments.
- Example: A student uses PivotTables to analyze GDP data for an economics project.
- Details: Impresses professors and strengthens viva answers.
- Automate Repetitive Tasks
- Use functions like VLOOKUP to merge datasets quickly.
- Example: A student automates expense tracking for a college fest.
- Details: Saves time for other study tasks.
- Present Data Professionally
- Create clear charts for group presentations or reports.
- Example: A student visualizes market trends in a marketing report.
- Details: Enhances project quality and grades.
- Validate Your Work
- Double-check formulas to avoid errors in calculations.
- Example: A student verifies SUM totals in a budget sheet.
- Details: Builds credibility in academic and internship tasks.
Action Tip: Start with small datasets to build confidence in applying Excel skills.
Benefits and Business Implications
Mastering Excel skills offers significant business implications for BBA students, boosting academic and career prospects:
- Enhanced Employability
- Excel proficiency is a top skill for internships in finance or marketing.
- Example: A student lands a data analysis internship due to PivotTable skills.
- Economic Impact: Increases job market competitiveness.
- Improved Decision-Making
- Data analysis supports informed choices in projects or jobs.
- Example: A student analyzes sales trends to recommend strategies.
- Economic Impact: Drives efficiency in business operations.
- Time Savings
- Automation reduces manual work in academic or professional tasks.
- Example: A student automates budget calculations for an event.
- Economic Impact: Frees time for strategic activities.
- Academic Excellence
- Excel enhances project quality and exam preparation.
- Example: A student uses charts for a finance presentation, earning high marks.
- Economic Impact: Builds a strong academic record for career growth.
Table: Business Implications of Excel Skills
| Implication | Economic Benefit | Practical Challenge | Action Tip |
|---|---|---|---|
| Employability | Boosts internship chances | Limited practical experience | Highlight Excel in resume |
| Decision-Making | Enhances project outcomes | Data interpretation errors | Practice with real-world data |
| Time Savings | Increases efficiency | Learning automation tools | Use VLOOKUP for merging data |
| Academic Excellence | Improves grades | Time for skill practice | Apply to coursework projects |
Action Tip: Add Excel skills to your resume and LinkedIn profile.
Challenges in Learning Excel Skills
Developing Excel skills as BBA students comes with hurdles, with solutions:
- Steep Learning Curve
- Advanced tools like PivotTables can be complex.
- Example: A student struggles with VLOOKUP syntax.
- Solution: Watch tutorials on Microsoft Learn.
- Calculation Errors
- Incorrect formulas lead to wrong results.
- Example: A student misuses SUM, skewing project data.
- Solution: Use Excel’s “Formula Auditing” tool to check errors.
- Time Constraints
- Balancing studies and Excel practice is tough.
- Example: A student skips practice due to exams.
- Solution: Schedule 15-minute daily sessions.
- Lack of Practical Data
- Students may not have real-world datasets to practice.
- Example: A student lacks sales data for PivotTable practice.
- Solution: Download free datasets from sites like Kaggle.
Action Tip: Start with basic skills to build confidence before tackling advanced tools.
Exam and Career Prep Tips Using Excel
Leverage Excel skills for academic and career success:
- Boost Exam Prep: Use Excel to analyze economics data or finance ratios.
- Enhance Projects: Apply charts or PivotTables for viva-ready presentations.
- Prepare for Internships: Practice skills recruiters seek, like data cleaning.
- Learn from Resources: Explore Forbes India for career tips.
- Showcase Skills: Include Excel projects in your portfolio or LinkedIn.
Action Tip: Create a sample Excel project (e.g., budget analysis) for viva or interviews.
Conclusion
Mastering Excel skills is a game-changer for business students, empowering you to excel in business analytics, ace projects, and land internships. By learning formulas, PivotTables, and visualization, and overcoming challenges, you’ll build a strong foundation in your studies. Start today with this guide, and explore resources like Microsoft Excel to boost your career journey and shine in the business world!
👨💼 Author: BBAProject Editorial Team
✍️ The BBAProject Editorial Team comprises business graduates and educators dedicated to creating practical, syllabus-based learning resources for BBA students.
⚠️ Please Note: Articles published on BBAProject.in are well-researched and regularly updated. However, students are advised to verify data, statistics, or references before using them for academic submissions.