
Primary vs Secondary Data is a foundation block of BBA projects which results in constructing well-structured quality based reports that score well at assessment points in academics and internships. It is important to know how to gather, examine and then combine the Primary vs Secondary Data with strategic theoretical techniques i.e. SWOT analysis so as to ace papers like marketing, finance and management. This article explores the distinctions between primary and secondary data, their origins, using them in SWOT analysis and logical steps that will enable you to create a strong BBA project report. This article brings to the forefront, examples, actionable techniques and exam tricks that BBA students can make use of to ensure a consistent academic as well as career progression.
Understanding Primary Data in BBA Projects
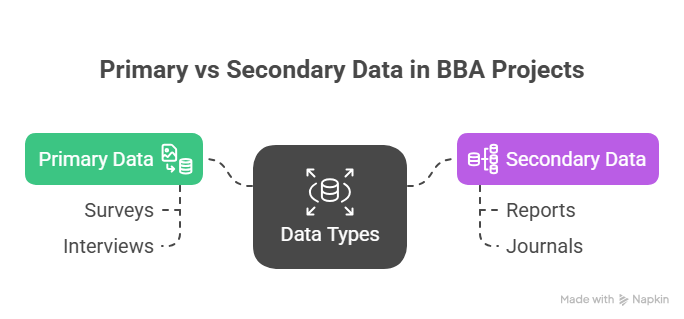
Primary data are already existing information newly generated by the researcher himself, by means of procedures designed to fit special requirement of a BBA project. Within the frame of Primary vs Secondary Data, primary data is valued for its newness and focus. For example a students conducting research on a new product and consumer preferences in relation to that products could survey 100 customers on shopping habits. It is just as authentic as information that comes directly from the source, but it does require to invest more time and effort into sifting through the data (and in some cases money). Original data is best for projects that involve unique insights not found anywhere else, like local market trends or customer behavior in a niche industry.
Sources of Primary Data
Sources of primary data are varied and students of BBA can collect firsthand data. Surveys and questionnaires, which are frequently distributed in tools like Google Forms or SurveyMonkey, gather quantitative data that includes ratings for customer satisfaction. Formatted interviews, either structured or open-ended, allow for qualitative depth similar to deriving insights from store managers about operational challenges. Observational Observing behaviors occurring in real time, such as counting the number of customers entering a retail location to monitor shopping activity. Focus groups are how you talk to small groups of people in order to gauge attitudes around things (like, say, how well consumers might respond to a new offering). Experiments, while less frequent (but again, definitely present), may include running marketing campaigns in controlled environments. They are being used to map the data sources to ensure the data matches their project objectives.
For example: A video where a student claims to have carried out an online survey using Google Forms, of 10 questions where they ‘asked’ (of 10 approved people) whether the students preferred shopping online.
Secondary Data Collection for BBA Projects
Secondary data, on the other hand, is already gathered or collected by someone else and is available for use. Therefore, it plays a crucial role in a Primary vs Secondary Data comparison. These might include academic journals, government reports, industry analyses, company documents and online databases such as Statista or World Bank. For instance, a student focused on retail trends might use a 2024 industry report from McKinsey to track e-commerce growth. A secondary data is an inexpensive and swift accessible method, which gives wider perspective for a BBA projects. But it might not be applicable or up to date, leaving students on their own to check its veracity). It is excellent for identifying market trends, competitor benchmarks or historical information.
Sources of Secondary Data
Electronic databases used to locate secondary data include. Peer-reviewed journals, which you can find through sources like JSTOR or Google Scholar, reveal academic views on issues such as consumer behavior. Some government databases, like those of the U.S. Census Bureau or India’s Ministry of Statistics, maintain reliable economic and demographic data. Reports from industry research firms, such as Deloitte or IBISWorld, provide a description of market dynamics. Company concepts, and associated case studies, are also enriched by company records including annual reports and financial statements. Statistical information is found in online databases such as Statista, and current trends can be obtained from various types of media (trade publications; news articles). The most recent sources (after 2023) and credible sources are to be stressed.
Illustration: A learner may rely on a 2024 report from the Ministry of Commerce to consider export patterns in an international business project, easing his or her burden for data collection.
Comparing Primary and Secondary Data
BBA learners should have knowledge of Primary and Secondary Data in order to make an informed data collection decision. Primary data provides specificity at the expense of resources, and secondary data is resource-efficient but lacks idiosyncrasy. A mixed approach provides a solid foundation for BBA studies by merging primary data depth with secondary data breadth. For example, a learner could poll 100 customers to gather data on product satisfaction (primary) and access a government report to learn about the market growth (secondary). This inclusions gives a variety of perspectives, and can be well used for something like swot analysis.
| Aspect | Primary Data | Secondary Data |
|---|---|---|
| Source | Collected directly by the researcher | Obtained from existing sources |
| Purpose | Specific to the current study | General or for another original purpose |
| Collection Time | Time-consuming and resource-intensive | Quick and low-cost |
| Relevance | Highly tailored and current | May require adaptation; could be outdated |
| Reliability | Controlled by researcher, high accuracy | Depends on source credibility |
| Examples | Survey of 50 customers on brand loyalty | 2024 report on e-commerce growth |
Exam Tip: Be prepared to explain Primary vs Secondary Data differences in viva for research methodology questions.
Role of SWOT Analysis in BBA Projects
SWOT analysis– Strengths Weaknesses Opportunities and Threats are a useful tool that helps create BBA project reports. The strengths and weaknesses concentrate on internal factors which include a strong brand, lack of resources in an organization etc. Opportunities and threats consider external factors, such as market growth or increased competition. As an example, if a student is analyzing a retail business then they might highlight loyal customers as strength and high operational costs as weakness but also note e-commerce growth as opportunity with new competition being threat. SWOT enhances data to bring out insights to act upon, dovetailing with syllabus topics such as strategic management And upgrading the quality of reports for assignments feats on internships.
Certificate for Project 10 Sample Certificate Templates, Tips and Structure
Key SWOT Components:
Opportunities and Threats: Internal weaknesses or strengths, such as inefficient operations or obsolete technology.
Opportunities & Threats: Environmental factors such as market trends or regulation. Exam Tip: Practice SWOT using examples from your own organization, to prepare for Case Based Questions in the exam.
Practicalities of How to Implement in BBA Projects
The combination of primary V/s secondary data along with SWOT analysis makes BBA projects more solid in analytical terms. Internal factors (strengths and weaknesses) are developed from the primary data through particular insights, such as 80% customer satisfaction being generated from a survey as strength. Secondary data validates the external factors (opportunities and threats), such as industry study with 12% market growth being opportunity. Using survey data (primary), a student could confirm brand loyalty and allocate it in an SWOT matrix (figure 2) to suggest digital expansion, whereas the industry reports (secondary) may help him might conclude about e-commerce trends.
Integration Steps:
Primary Data for Internal Analysis: Are strengths and weaknesses identified by surveys or interviews (i.e., 75% of customers value quick delivery).
-) Secondary Information External Analysis: Source information for opportunities and threats (e.g., 10% e-commerce growth as reported in a 2024) report.
SWOT Table: Place the results in a SWOT table to suggest strategies (e.g., suggest faster delivery services). Example: A survey of 100 customers (primary) indicates that 75% prefer fast delivery, a strength; a journal article (secondary) reports that market growth is increasing by 12%; an opportunity. 007 Strength Weakness You can link your information with SWOT in viva to prove your analysis.
Practicalities of How to Implement in BBA Projects
Here’s how to craft effective BBA projects with Primary vs Secondary Data and SWOT analysis:
Define the Scale: Describe what you are specifically focusing on for the project, like customer preference in a marketing strategy.
Gather raw data:Survey 50–100 people in your local area using instruments like Google Forms, with simple questions (10-question is sufficient, for example on shopping habits).
Collect secondary data: Collect recent (post-2023) data from reliable sources, e.g., government websites, Statista.
Use SWOT Analysis: Place findings in a SWOT matrix that identifies strengths (for example, high customer satisfaction), weaknesses (such as a tight marketing budget), opportunities (like market growth) and threats (competitors).
Write the Report: Organize a report with the following sections: Introduction, Methodology, Data findings, SWOT analysis and Recommendations.
Visualize Information: Visualize the survey results or SWOT for better understanding – present them in tables and/or charts.
Example: A student researches 50 customers (80% shop online, primary) and refers to a 2024 report featuring e-comm growth of 10% (secondary) to make suggestions on digital strategy using SWOT.
Challenges in Data Collection and SWOT Analysis
Primary vs Secondary Data Collection and SWOT analysis – A challenge for BBA Students. Firsthand data is also a time-consuming process; it may take you one week to survey 100 customers. Begin early, and consider the use of digital tools such as Google Forms to help keep up with your responses. Secondary sources might be stale or not relevant, like a 2015 retail report. Focus on the sources that post-date 2023 and choose reputable platforms like government websites or Statista. There is plenty of misuse in SWOT analysis: students might add “new competitors” as a weakness instead of a threat. Classify the factors correctly by using internal/external criteria.
Key Challenges and Solutions:
Primary Time Sinks Data Collection: Get this out of the way early, leverage digital survey tools.
Stale Secondary Data: Use relevant, up-to-date and credible reports (post-2023).
Mis-Identification of SWOT : Think about and use the criterion within/beyond. Take for example: A poll of 50 customers (primary) identifies brand loyalty to be at 70% (strength); a report (secondary) highlights competitor growth gauged around 15% (threat). Exam Tip: Mention difficulty in collecting data in descriptive answer to show problem solving ability.
FAQs on Primary vs Secondary Data in BBA Projects.
Why is primary data necessary for BBA assignments?
When is it appropriate to use primary data? A: Primary data offers particular, current insights that are specifically relevant to the research question (e.g. surveying consumers about their likes) and is best suited for novel questions.
Can a BBA project use only secondary data?
Secondary data provides background information but, by itself, can lead to trivial findings. Adding previously unpublished material to it brings originality and richness to the project.
How do I ensure secondary data is reliable?
Use credible sources like government databases, academic journals, or industry reports from reputable firms (e.g., McKinsey, Deloitte) and prioritize post-2023 data.
How does SWOT analysis enhance BBA project reports?
SWOT organizes primary and secondary data into actionable insights, helping students propose strategic recommendations, such as leveraging market growth opportunities.
What’s the best way to integrate primary and secondary data in SWOT?
Use primary data for internal factors (strengths/weaknesses) and secondary data for external factors (opportunities/threats), then create a SWOT table to align findings with recommendations.
Conclusion
Commanding Primary and Secondary Data and SWOT analysis is the key for developing distinctive BBA project reports. Primary is the ‘new news’ (tailored findings that are purposefully generated for this evidence base); secondary data provides a context within which.SWOT brings these together in strategic recommendations. By following the steps, surmounting difficulties and tips for examination, BBA students can make good projects which are high scoring in academics, at the same time gives a strong base leading to professional success in business careers.